Create a map with MapFast : example files
Use this page to understand how to structure your data to create a map with MapFast.
I referenced a few examples below, that you can download and reuse as a base file. 🙂
Example data - World map
The following is an Excel file containing the World GDP per country, from the WorldBank.
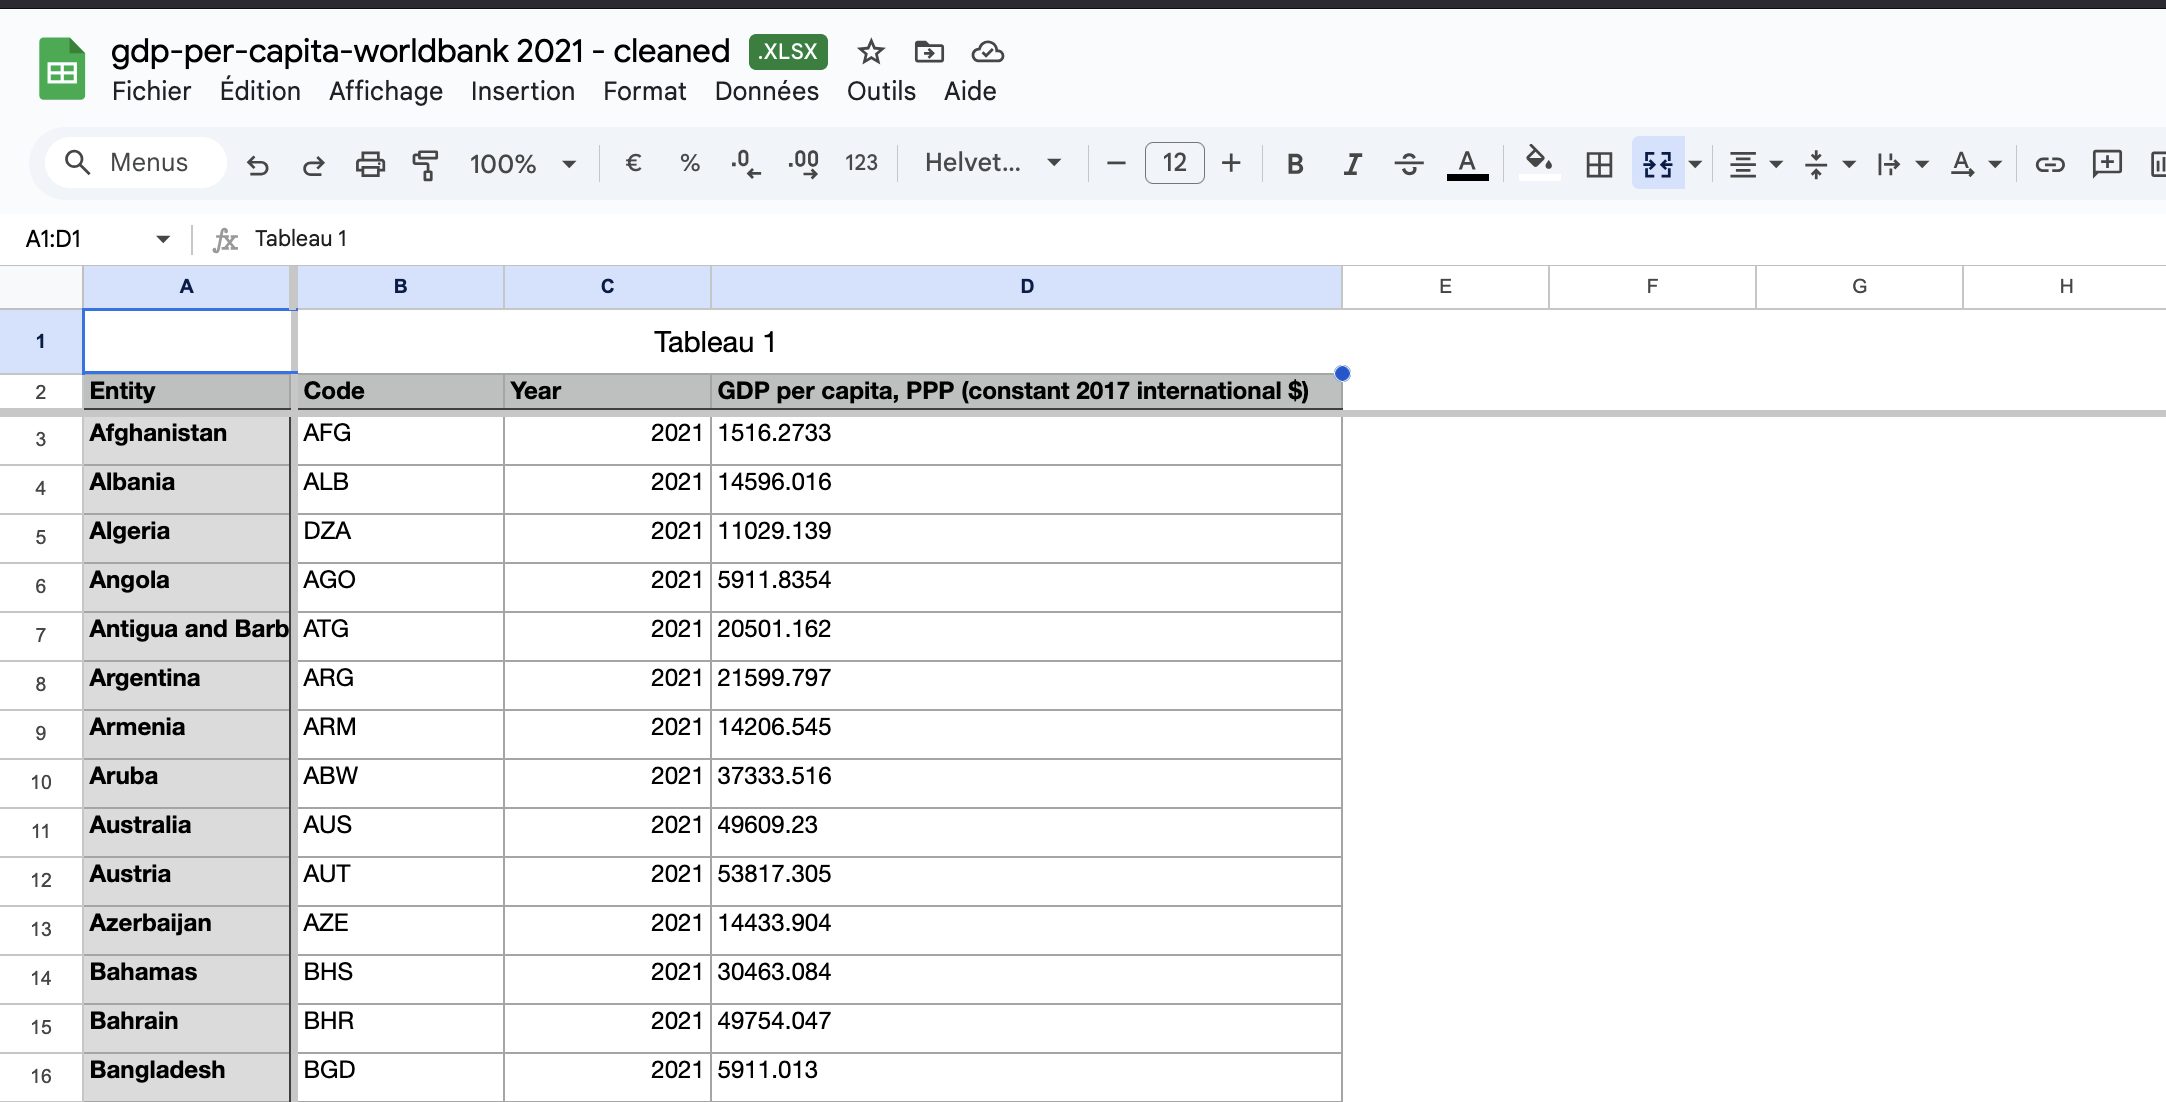
Initially, the dataset contained many years, but I filtered the data and extracted the results into a new sheet to be sure that I had only the values for year 2021. The rest of the file is clean: it has clear country names and the GDP per capita column is numerical. The “code” column could be removed safely.
Example data - State map (United States of America)
The following dataset is a dataset I used to create a map to count the number of Electric Vehicles registration in the US. The original dataset contained non-EV columns that I cleaned, I also manually computed “per capita” information to be able to create a normalized choropleth map.
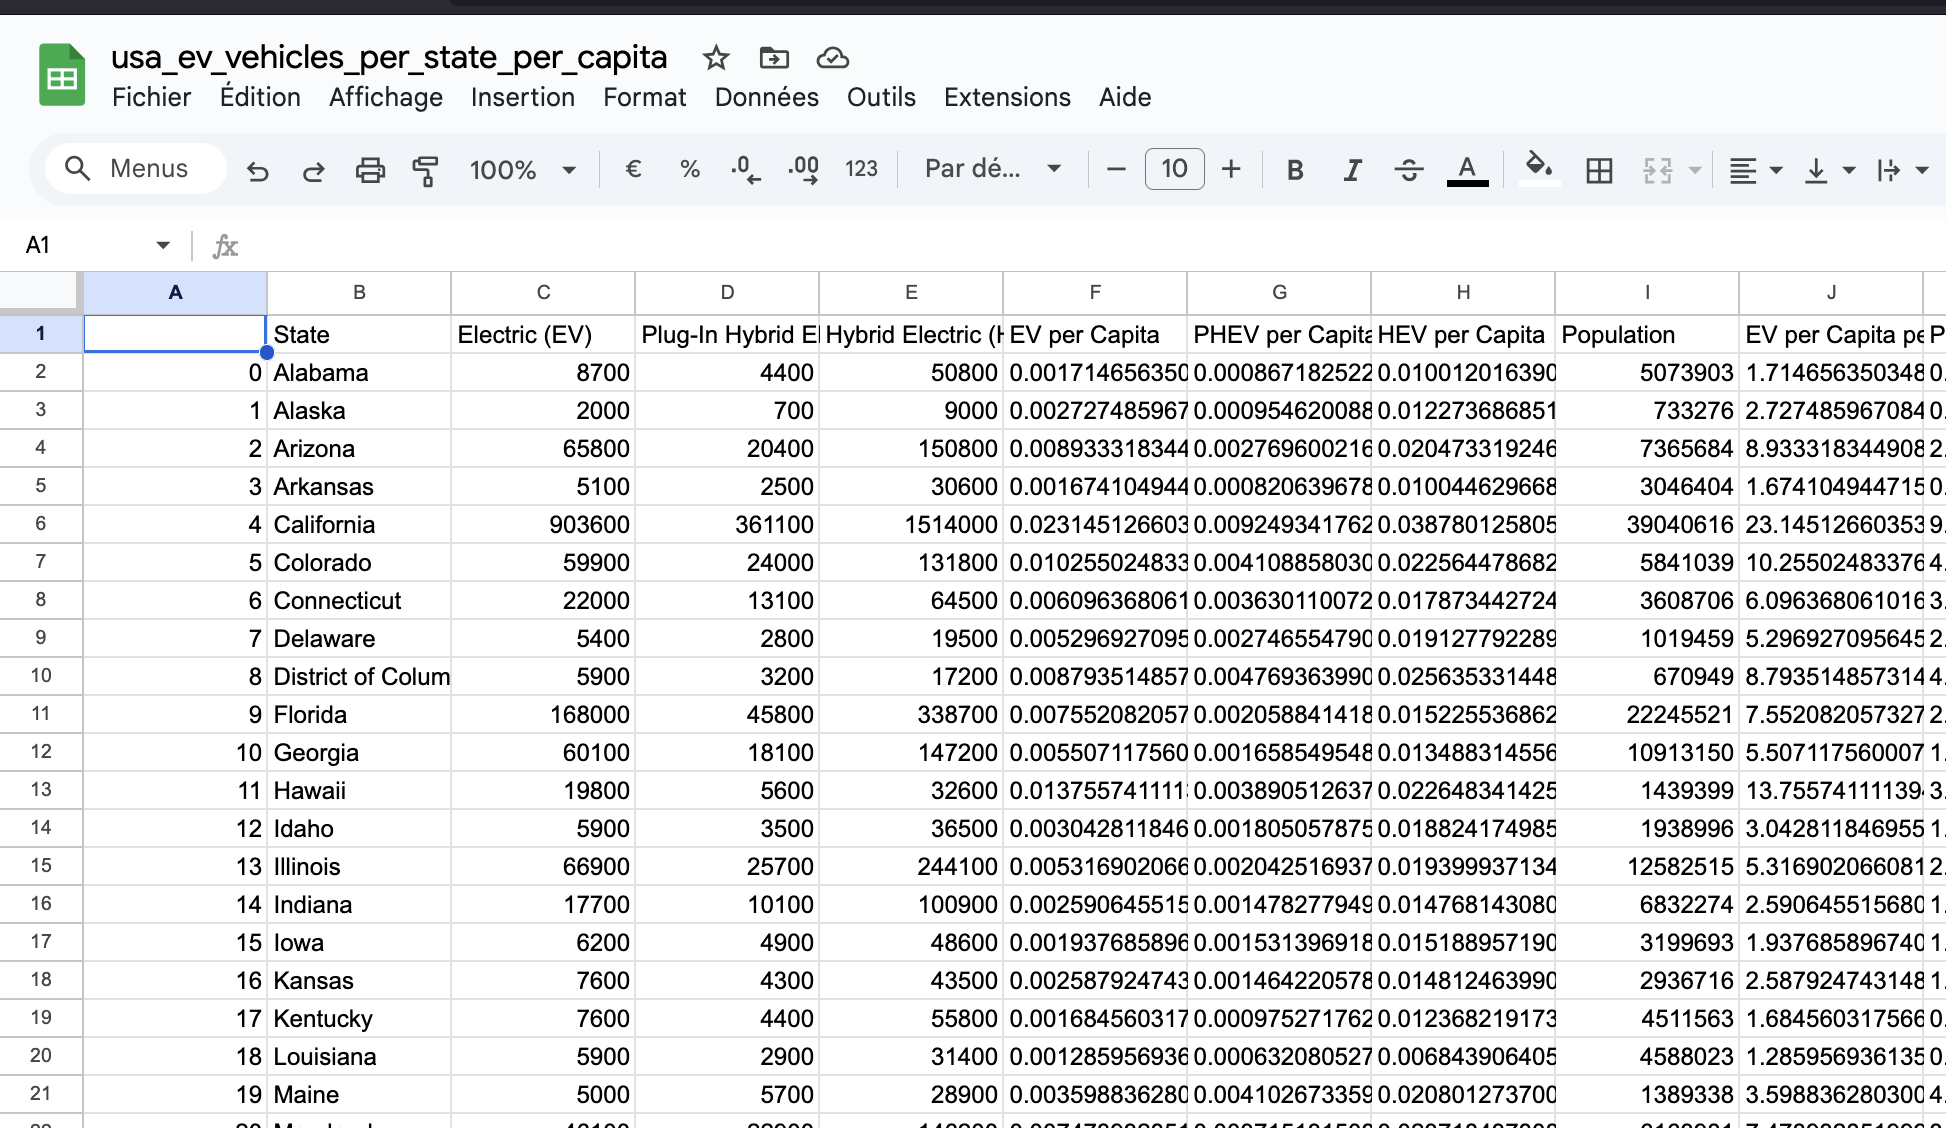
All the states are named clearly in the “State” column; so MapFast can detect easily that the dataset is entirely about the USA. The number of columns is low (under 20) so it won't cause any issues during import. All columns are numerical.
You can do the same kind of dataset for any country. Instead of States, it can be other administrative areas: Cantons, Regions, Departments, …. for another country.
Example data - categorical colors
The following is a very simple csv file that I created manually to explore categorical maps. It contains Climate Zone categorization for world countries.
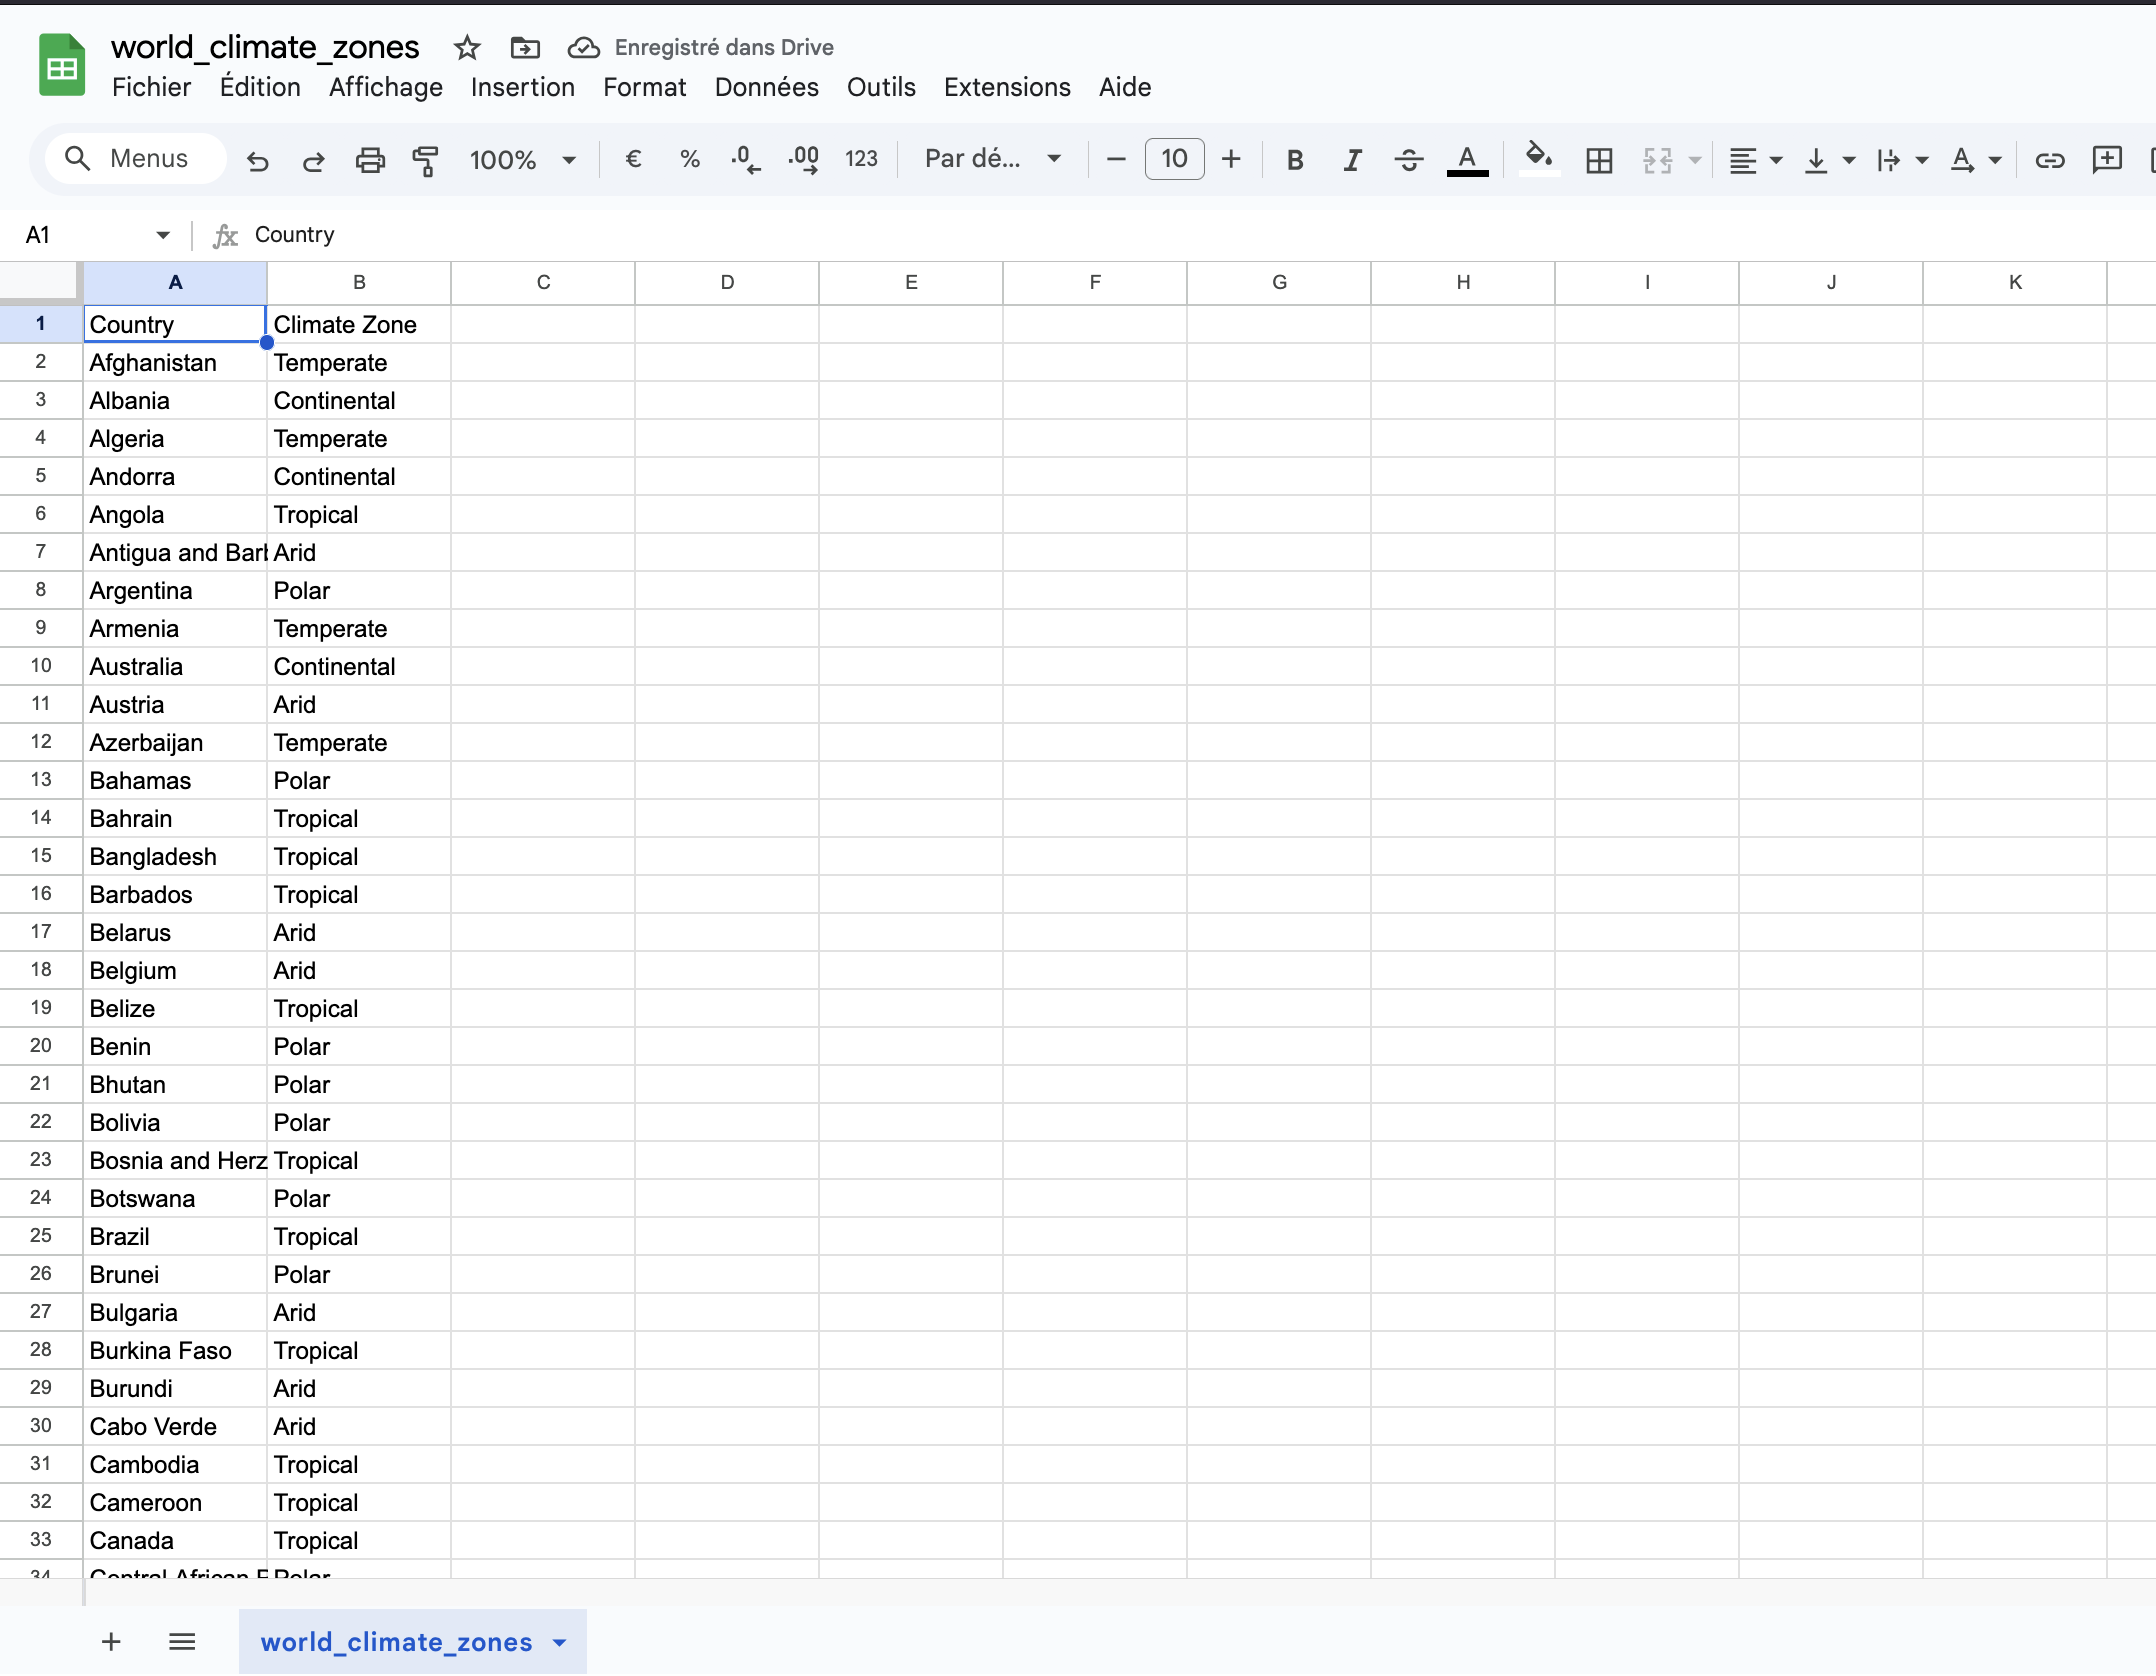
This file is very simple, making it very easy for MapFast to understand how to make a map out of it. The “Climate Zone” column will be detected as a list of strings, thus categorical data.
The next step will be to change the colors into the web app!
Example data - real estate map
The following is a completely different dataset as it contains precise adresses. It’s an extract of a real estate list of apartments for sale in Antwerp, Belgium in 2025.
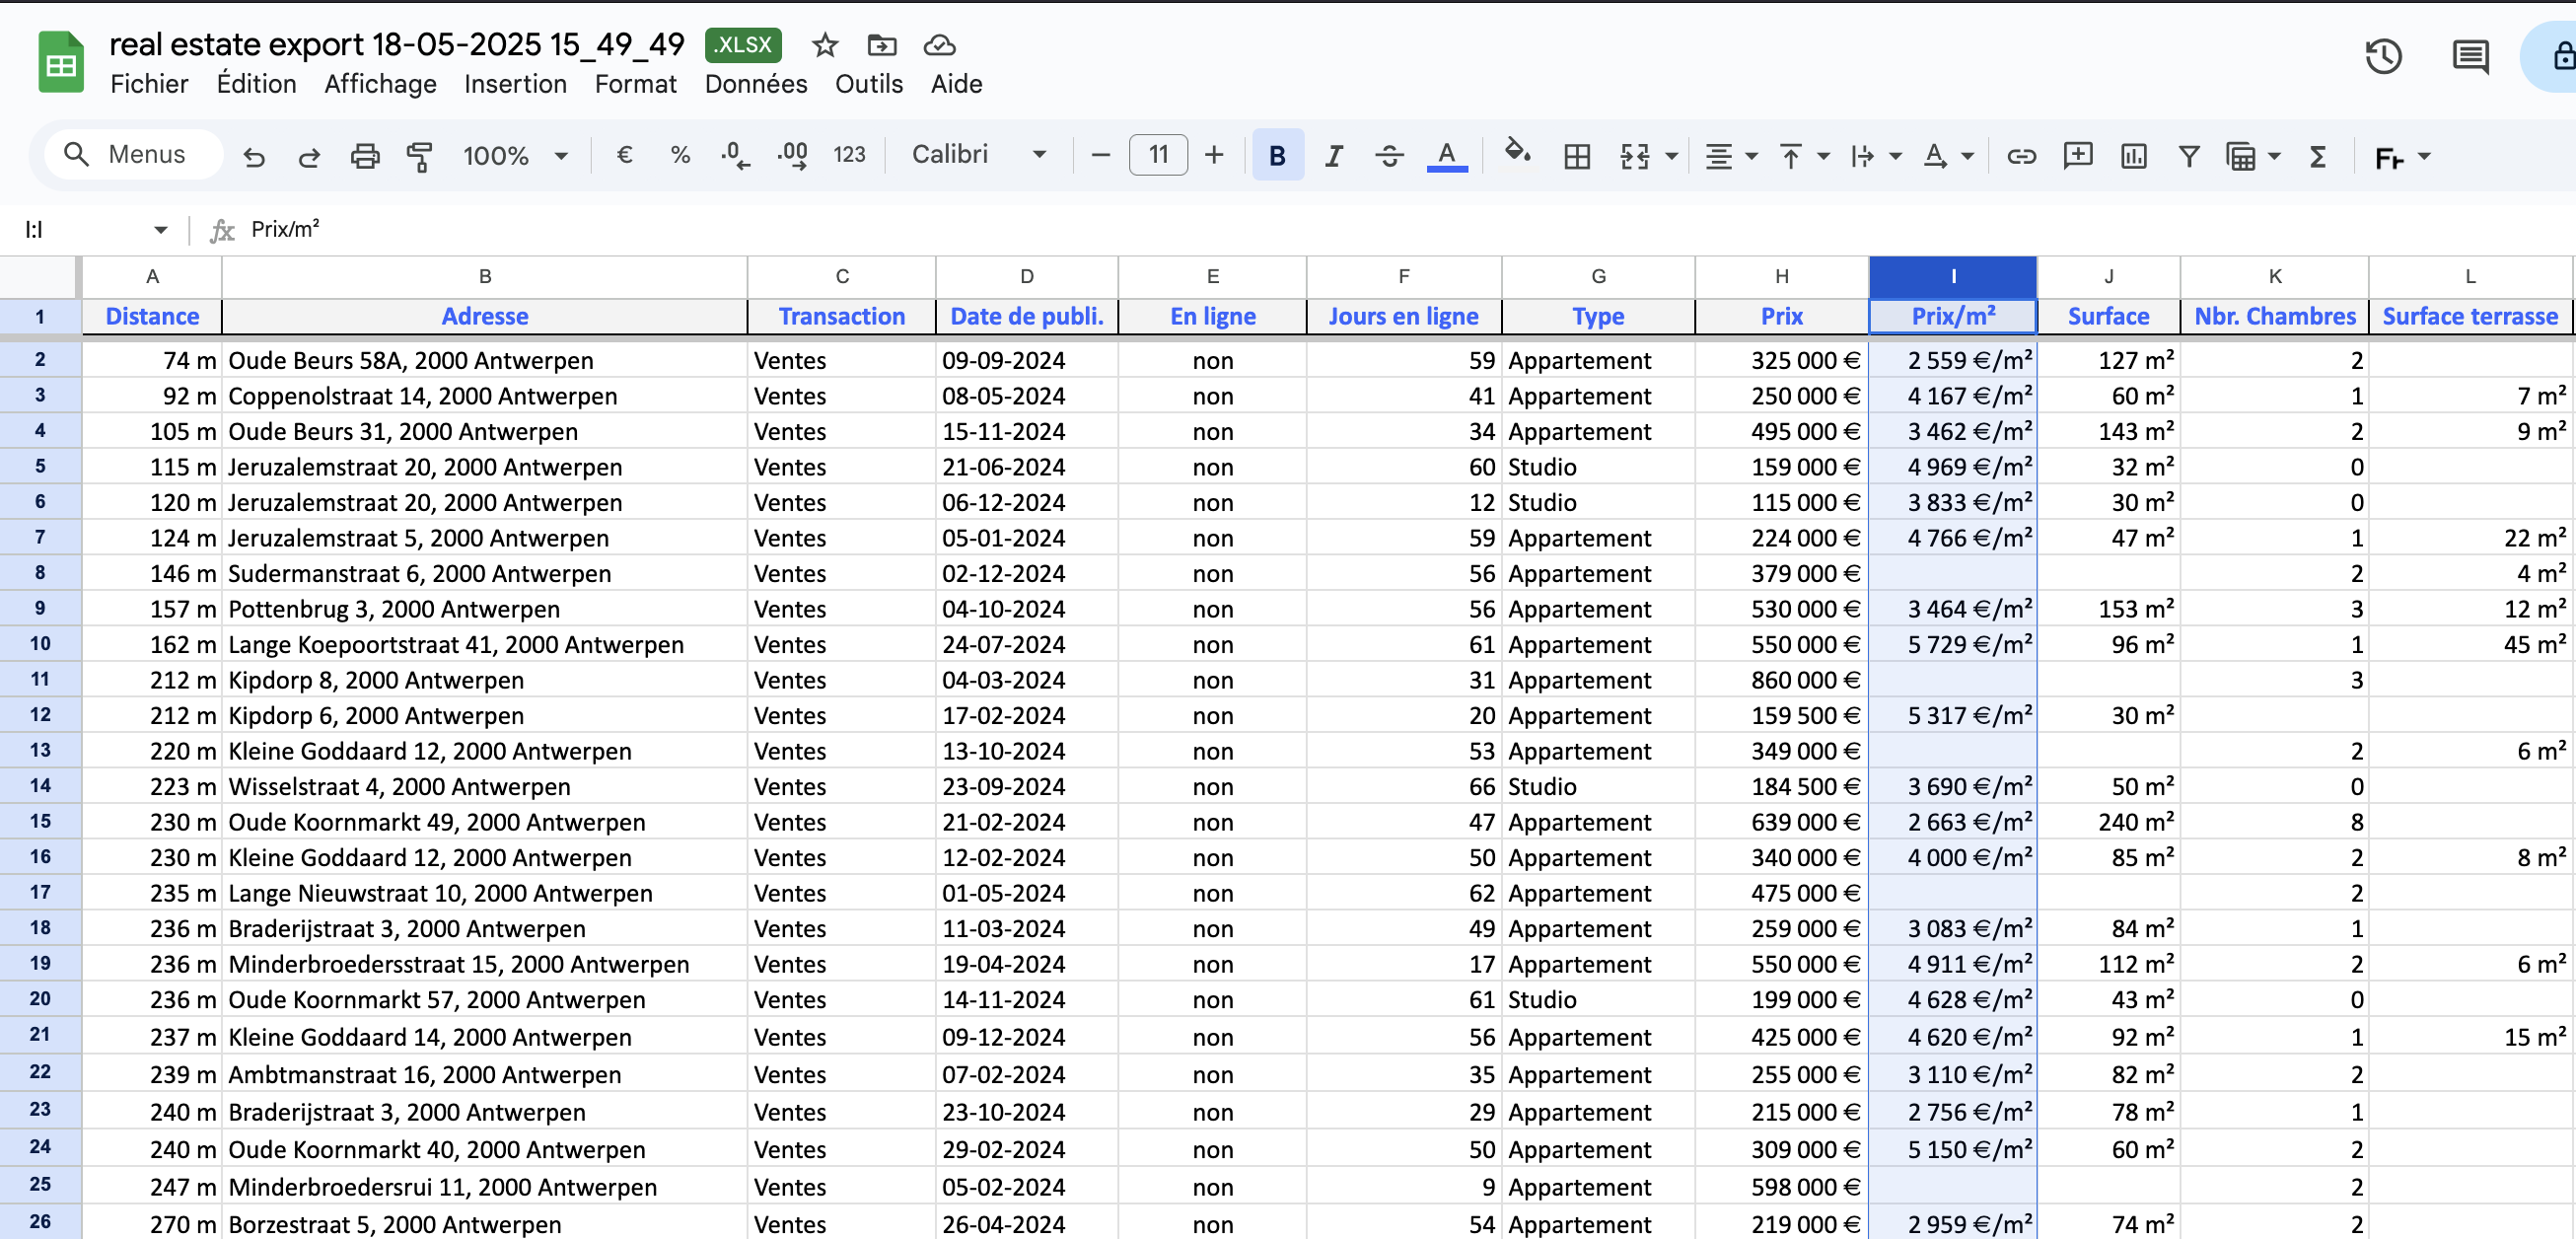
The dataset contains a clear address column that MapFast will detect and use for geocoding. The rest is a mix of categorical and numerical data, perfect for creating various maps!
There was no difficulty with this dataset as it’s already clean.
Example data - point of interest & street names
This dataset is a list of restaurant in Dubai (original link). It contains heterogeneous adresses: sometimes precise addresses, and sometimes just streets or points of interest.
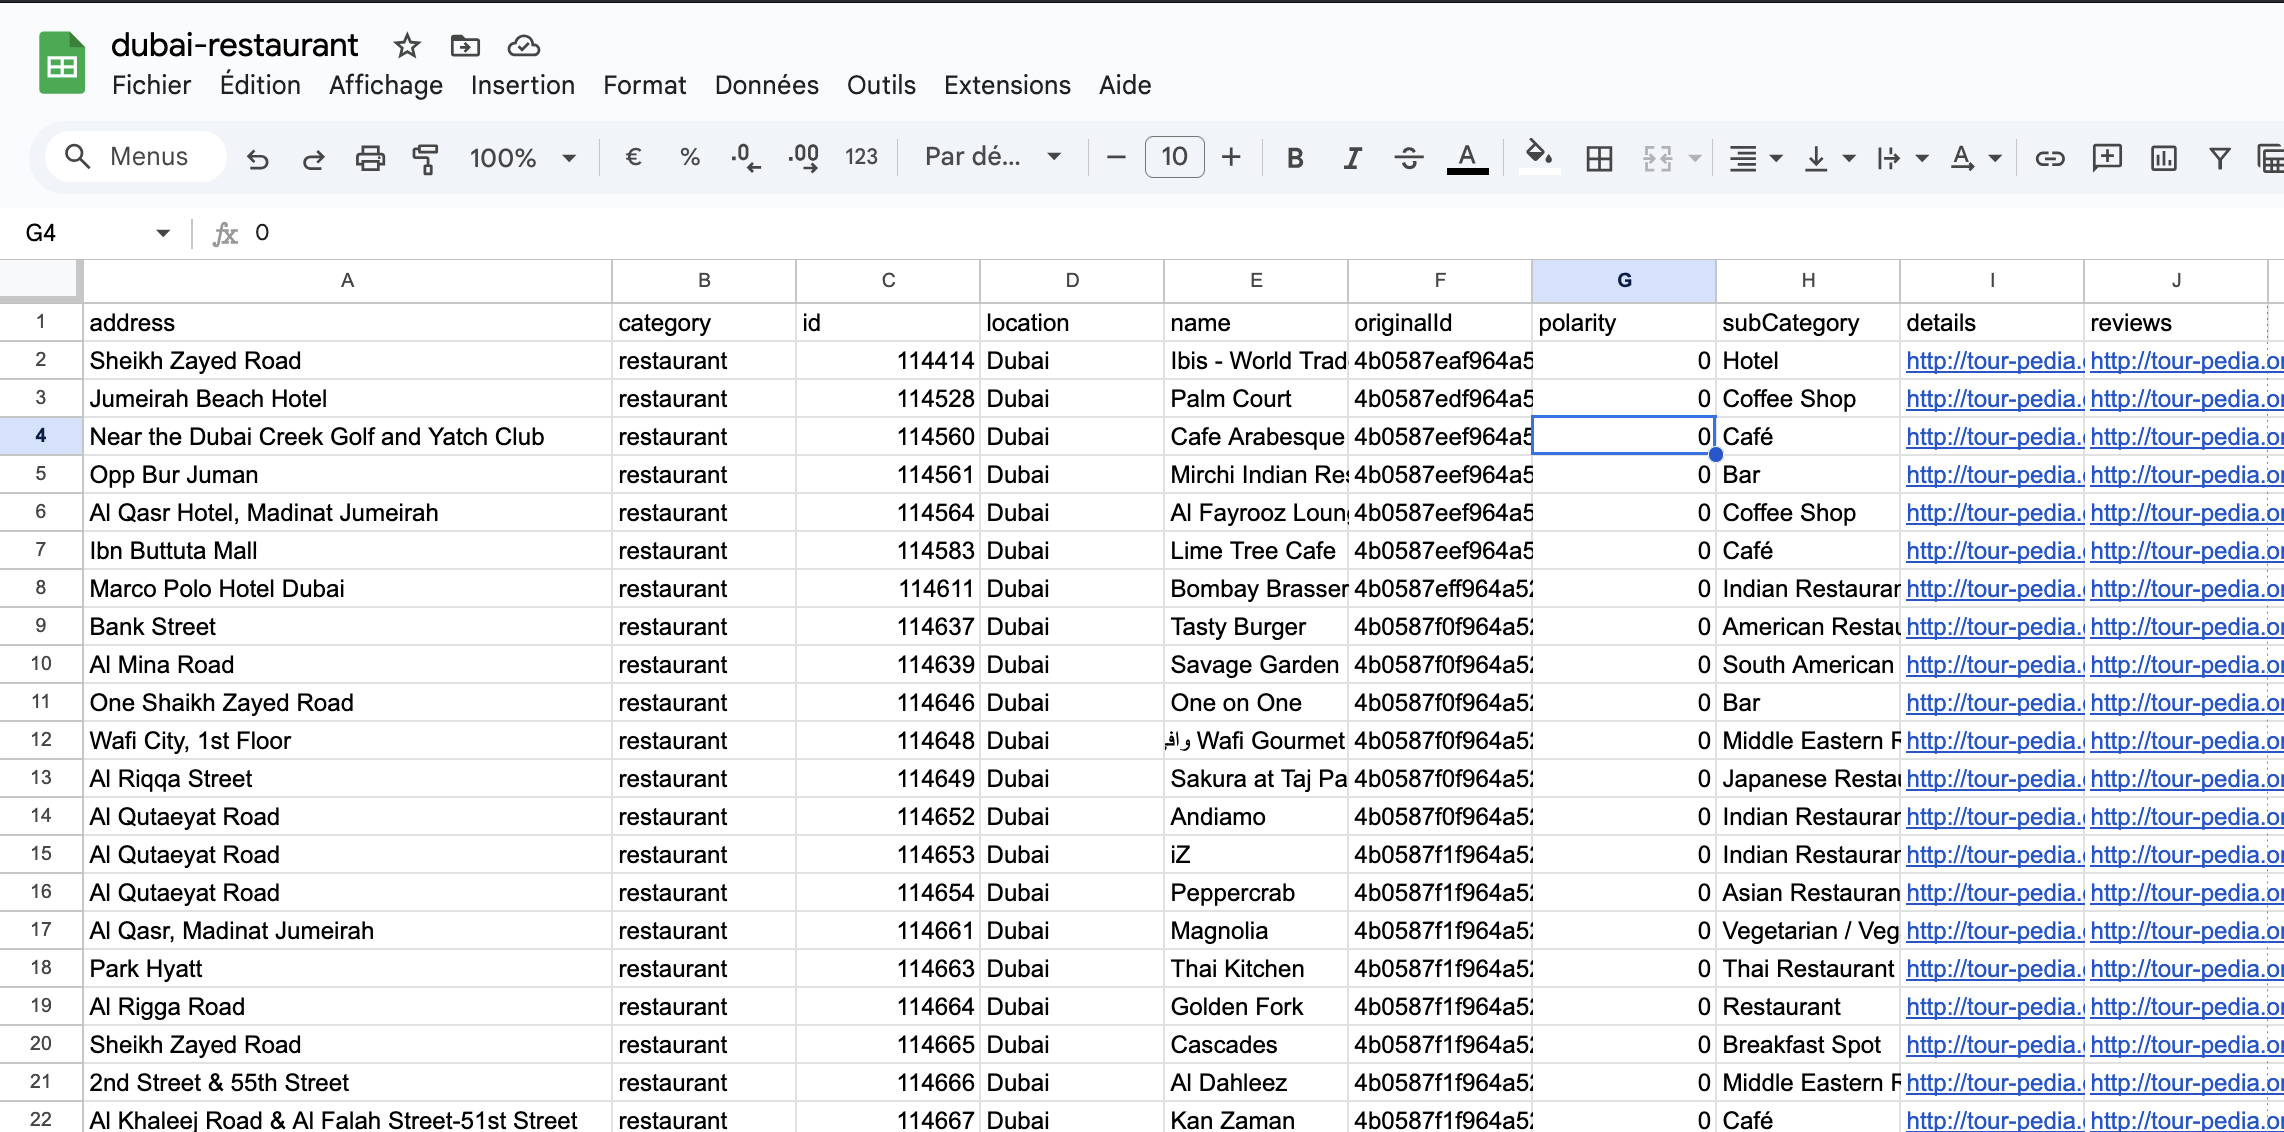
It was a bit messy and needed some cleaning and was also too large, so I just kept and excerpt of it.
It has an “address” column which can be geocoded and a “subCategory” column that can be used to map restaurants types to different colors, which is nice for a map. 🙂 Thanks to the “location” column referring to “Dubai”, MapFast will focus on geocoding addresses in Dubai.
Conclusion
I hope these examples helped you to better grasp what kind of structured data files you can send to MapFast to create your map. Even though MapFast can automatically detect how to read your data, it can't yet clean or rearrange it for you.
Here is a list of general advices:
- ✅ One row = one location on the map: for now, MapFast does not support multiple values per location (e.g. multiple years of data). You need to filter your data so that each location has exactly one row in the file.
- ✅ Keep your file simple: remove all unnecessary data from your Excel file and keep only one sheet (if using an Excel file).
- ✅ Provide clear location names: for example, use city names (e.g. New York, Paris, London) or country names. Avoid abbreviations, and if you use zip codes, make sure to include a clear context (e.g. "94110, USA" instead of just "94110"), so MapFast can properly interpret the location.
- ✅ Ensure clear column types: if a column contains numbers, make sure it’s recognized as numeric in Excel. Otherwise, it may be interpreted as a categorical value (e.g. “103 meters” instead of 103 in a column named “distance”).
If you still can’t get your map done, contact us in the app within the chat. You can also check out our other tutorials here.
Happy mapping ! ⭐